Every plot with its real vigor seen from space, its yield forecast and its alerts —and, on top of each one, today’s action. Not a dashboard to look at: a decision to make.
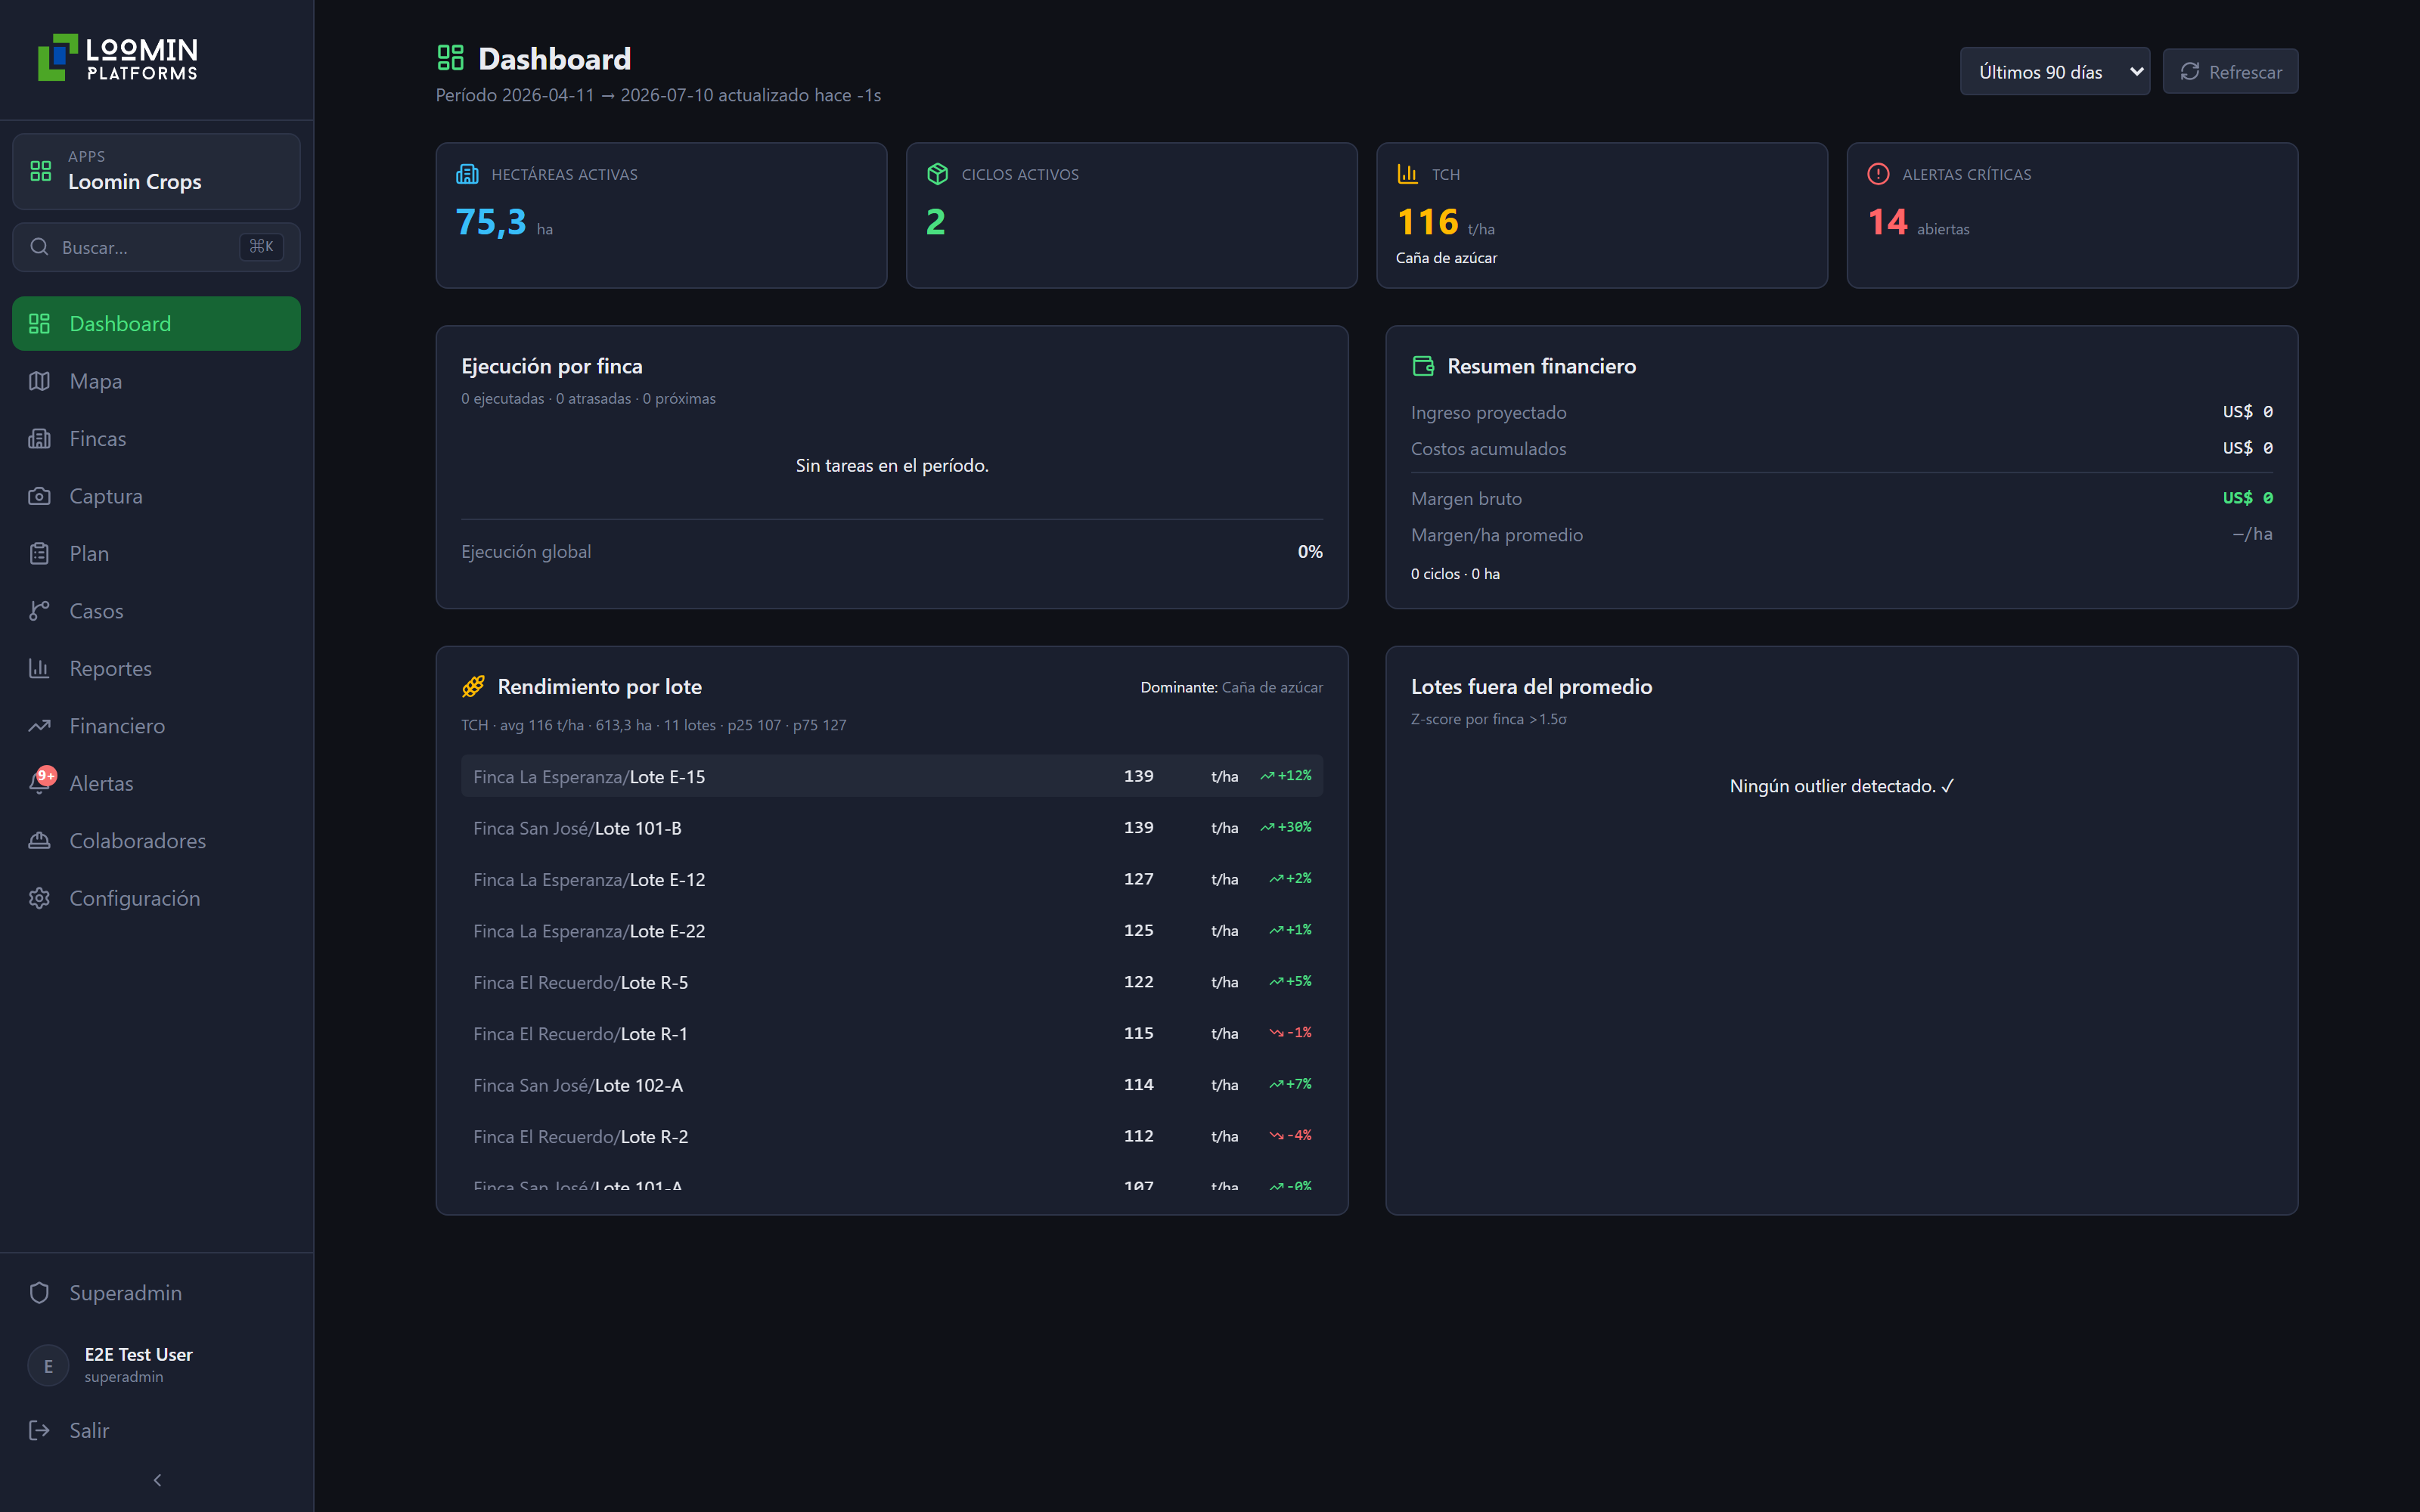
Real vigor seen from space, the yield forecast and the alerts for every plot —on one screen, with no exports and no stitching spreadsheets together.
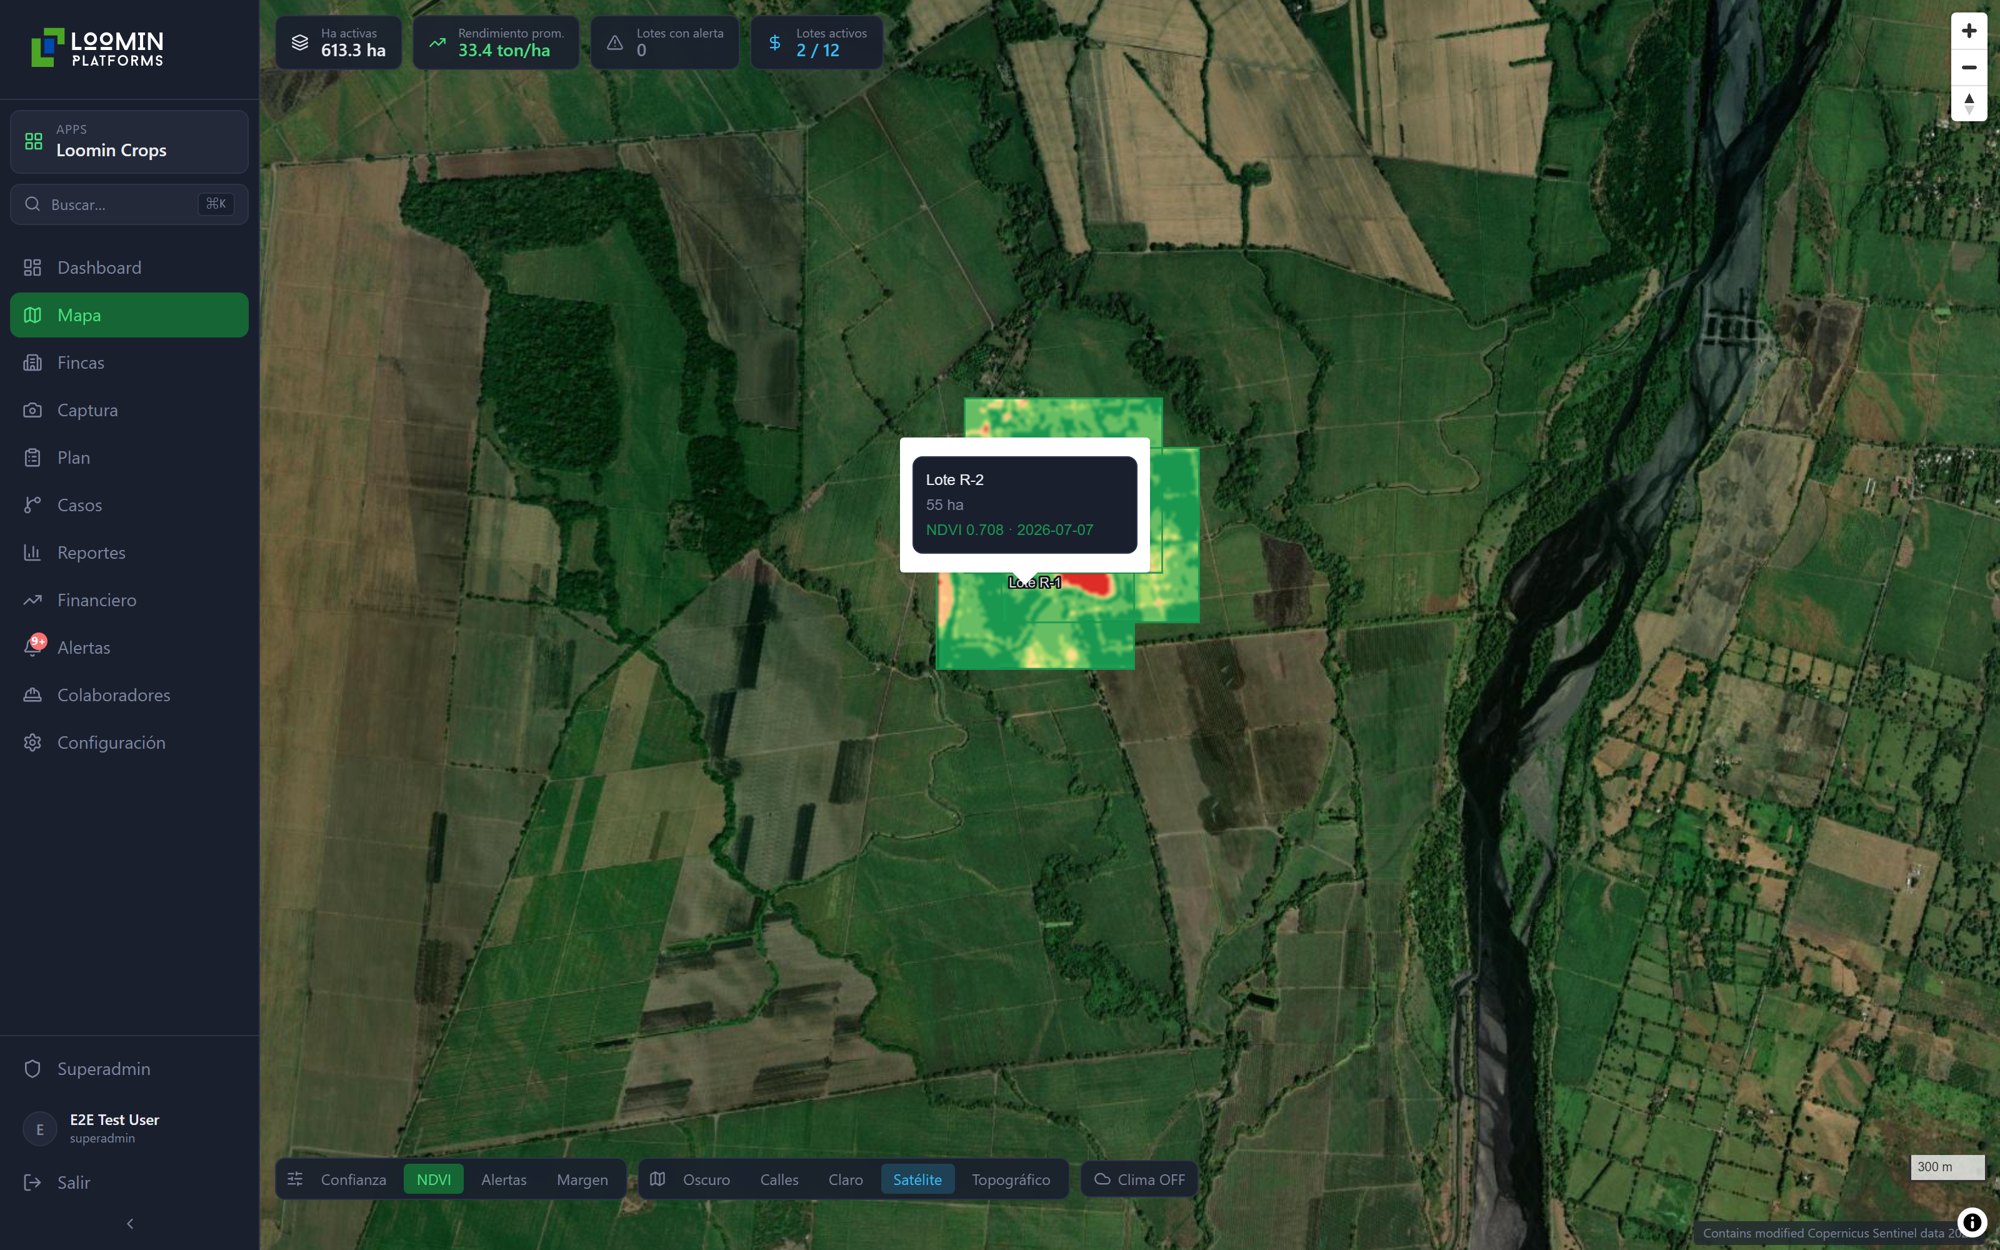
Each plot’s forecast, with its confidence range, is refined week by week against what the satellite observes. You commit volumes with a number, not a hunch.
Yield, water, soil and alerts together in one view. No exporting, no merging spreadsheets from three different systems.
A dashboard shows you numbers and leaves you the hard part: interpreting them and deciding. Loomin does that work.
Every screen in the app ends the same way: a concrete action —what to do, in which plot, when, and what it’s worth— with its confidence level right next to it. Not a data point for you to interpret; a decision for you to take or adjust.
How it works under the hood —the model, the satellite and the six data sources— is covered in Technology.
This isn’t a metrics dashboard to stare at. Every feature exists to answer a specific management question —and hand you the action, not the data.
Yield and season trajectory per plot, with a confidence range that tightens every week.
Vigor drops, water stress and pest hotspots detected from space, with their exact location inside the plot.
How much and when to irrigate and fertilize, based on each plot’s actual water and nutrient balance.
The optimal harvest point and the simulated effect of ripeners on yield.
Revenue, cost and margin per plot and per farm, updated with every logged application.
Before you apply, check whether the cost of the intervention pays for itself in added yield, based on your current season.
A per-plot calendar with suggested field work based on growth stage and detected deficits.
Simulate management changes or weather events and compare yield and margin before you commit.
A photo, a voice note or a text from the field technician becomes structured data and updates the forecast.
Technicians report applications, costs and photos from the app they already use —each message is matched to its plot automatically.
Assign tasks to the crew; each person checks off what they did, with timestamp and GPS location.
Your fertilizer and pesticide inventory with NPK formula, unit and cost —private to your organization.
Every recorded harvest sharpens next season’s model for your soil, your variety and your microclimate.
Your lab results refine the forecast; without them, we use a regional baseline and tell you so.
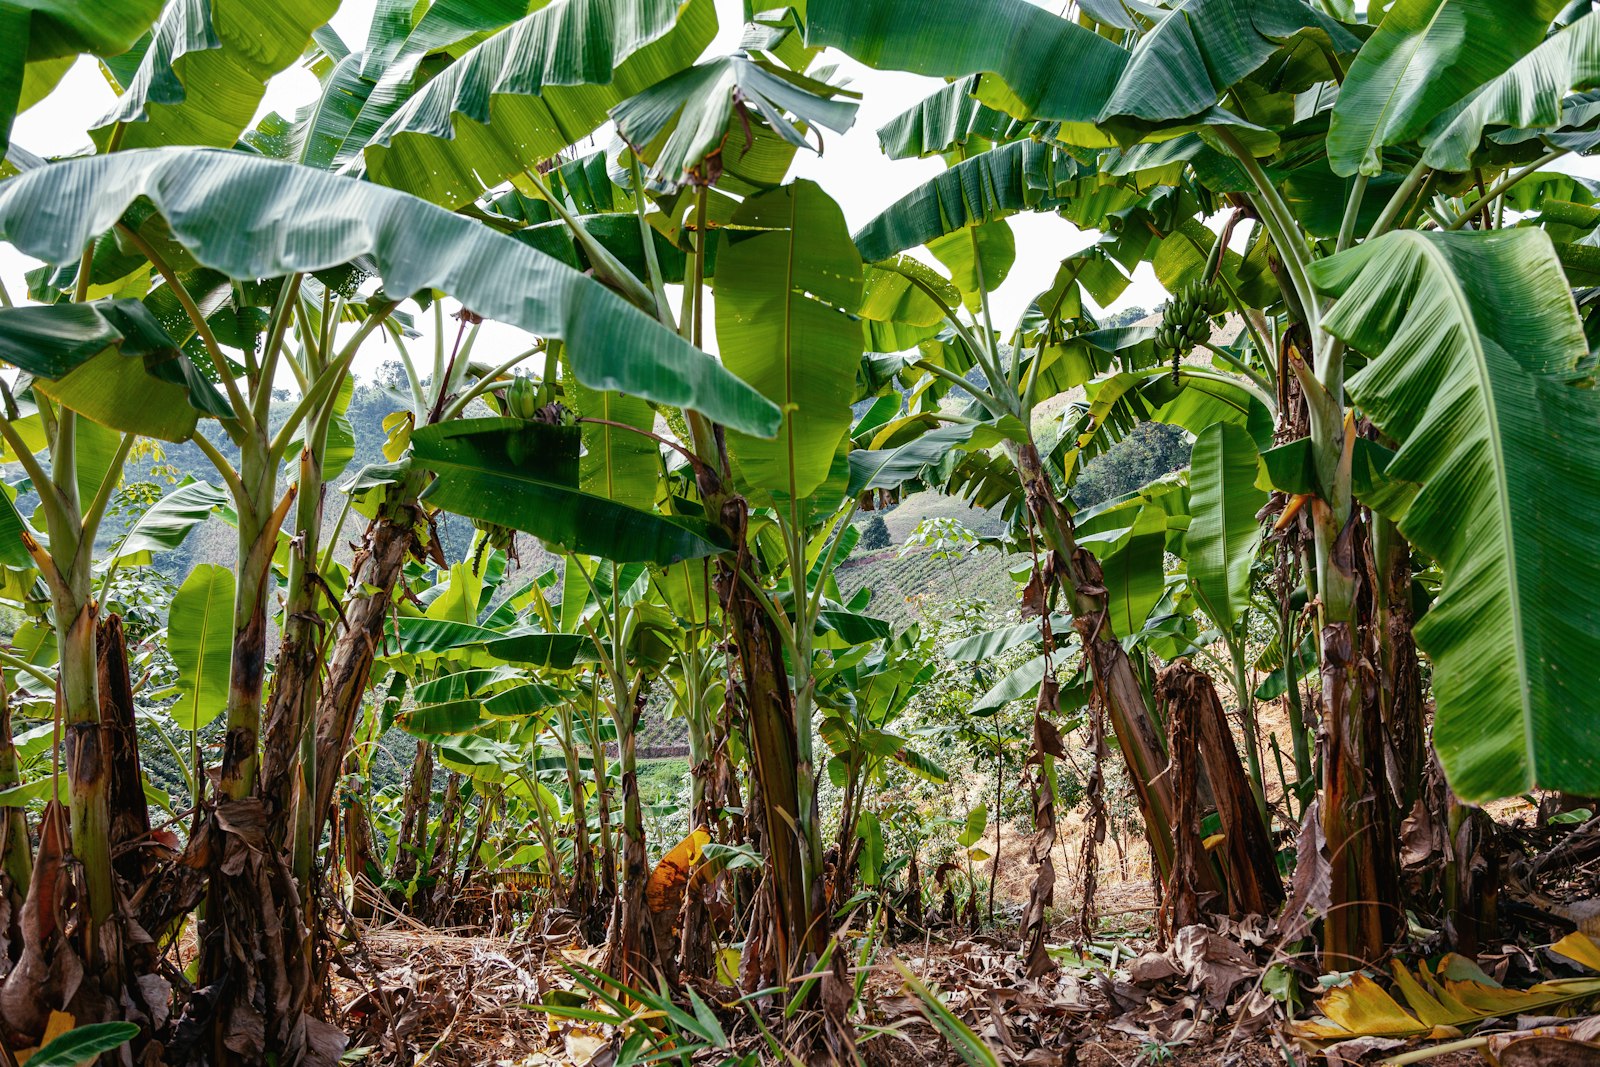
Every week, without lifting a finger: a new satellite image, an updated forecast and today’s action, ready on every plot.
Start with one plot and see it working on your own data —no hardware to install, nothing to migrate. Once you’re convinced, add the rest.