Loomin takes every signal from your fields —this week’s satellite pass, the weather, the soil, your field technician’s notes— and turns it into a decision: what to do, in which plot, and when.
18 mm today. Rain won’t arrive until Monday; waiting means two days of stress at a critical growth stage.
Every farm now generates more information than ever: satellite reports, vigor maps, weather stations, lab results, field spreadsheets.
And almost none of it changes a decision. Data gets filed, glanced at once, and forgotten. It arrives without telling you what to do.
Meanwhile, how much to apply, when to irrigate and when to harvest are still decided by eye. And every gut-call decision costs money —in both directions.
We spent years in Central American fields and saw the same thing everywhere: satellite reports nobody opens, vigor maps left in a folder, sensors feeding reports that don’t change a single decision.
Farms generate more information than ever. The problem isn’t a lack of data. It’s that data arrives without telling you what to do.
So we built Loomin. Every signal from your fields becomes a concrete action: what to do, in which plot, when, and what it’s worth. We do it with science you can audit —calibrated crop-physics models, weekly satellite imagery, and learning that improves with every one of your seasons— and one rule we don’t bend: we tell you where every number comes from and how confident we are in it.
Loomin doesn’t replace your agronomy team. It gives them what doesn’t exist today: an integrated view of the entire operation, in one place, ready to act on.
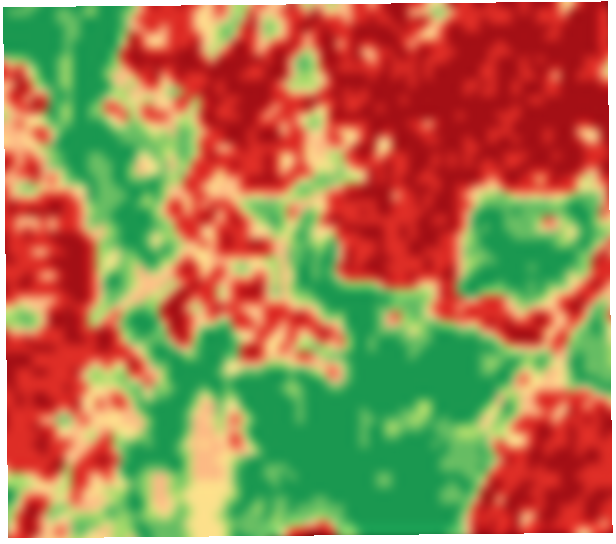
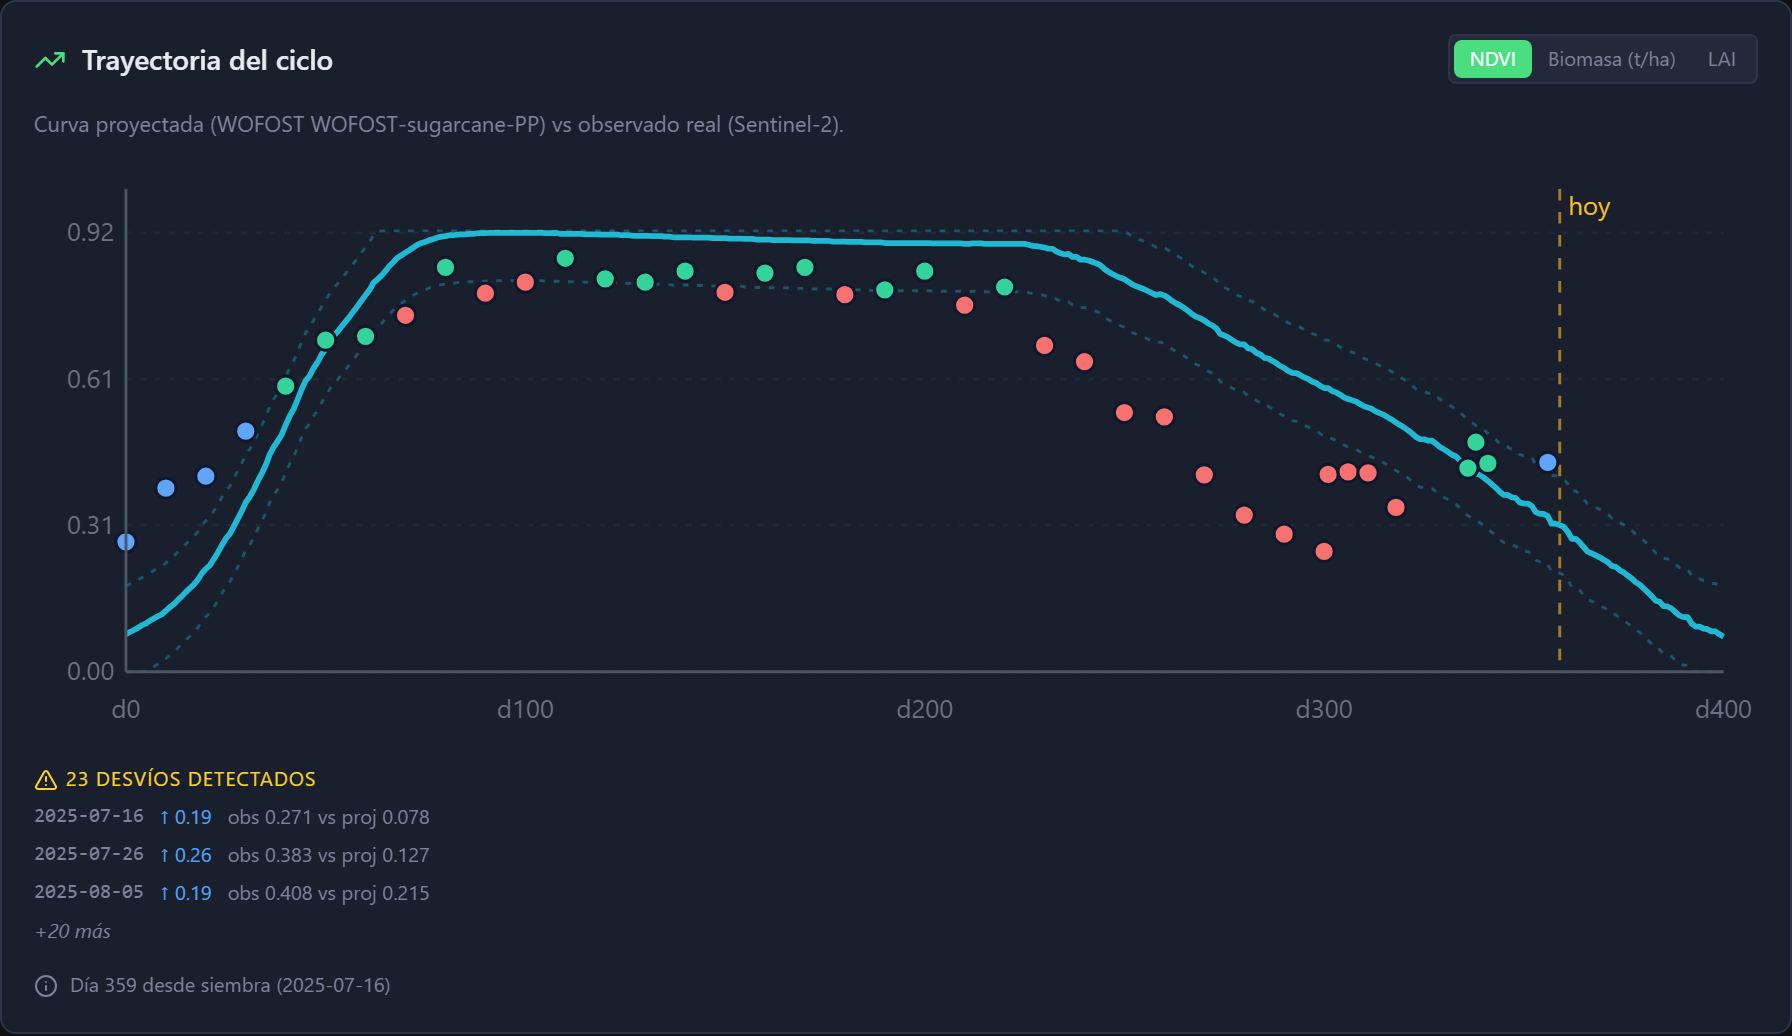
Every plot with its real vigor seen from space, its yield forecast and its alerts —no exports, no stitching spreadsheets together.
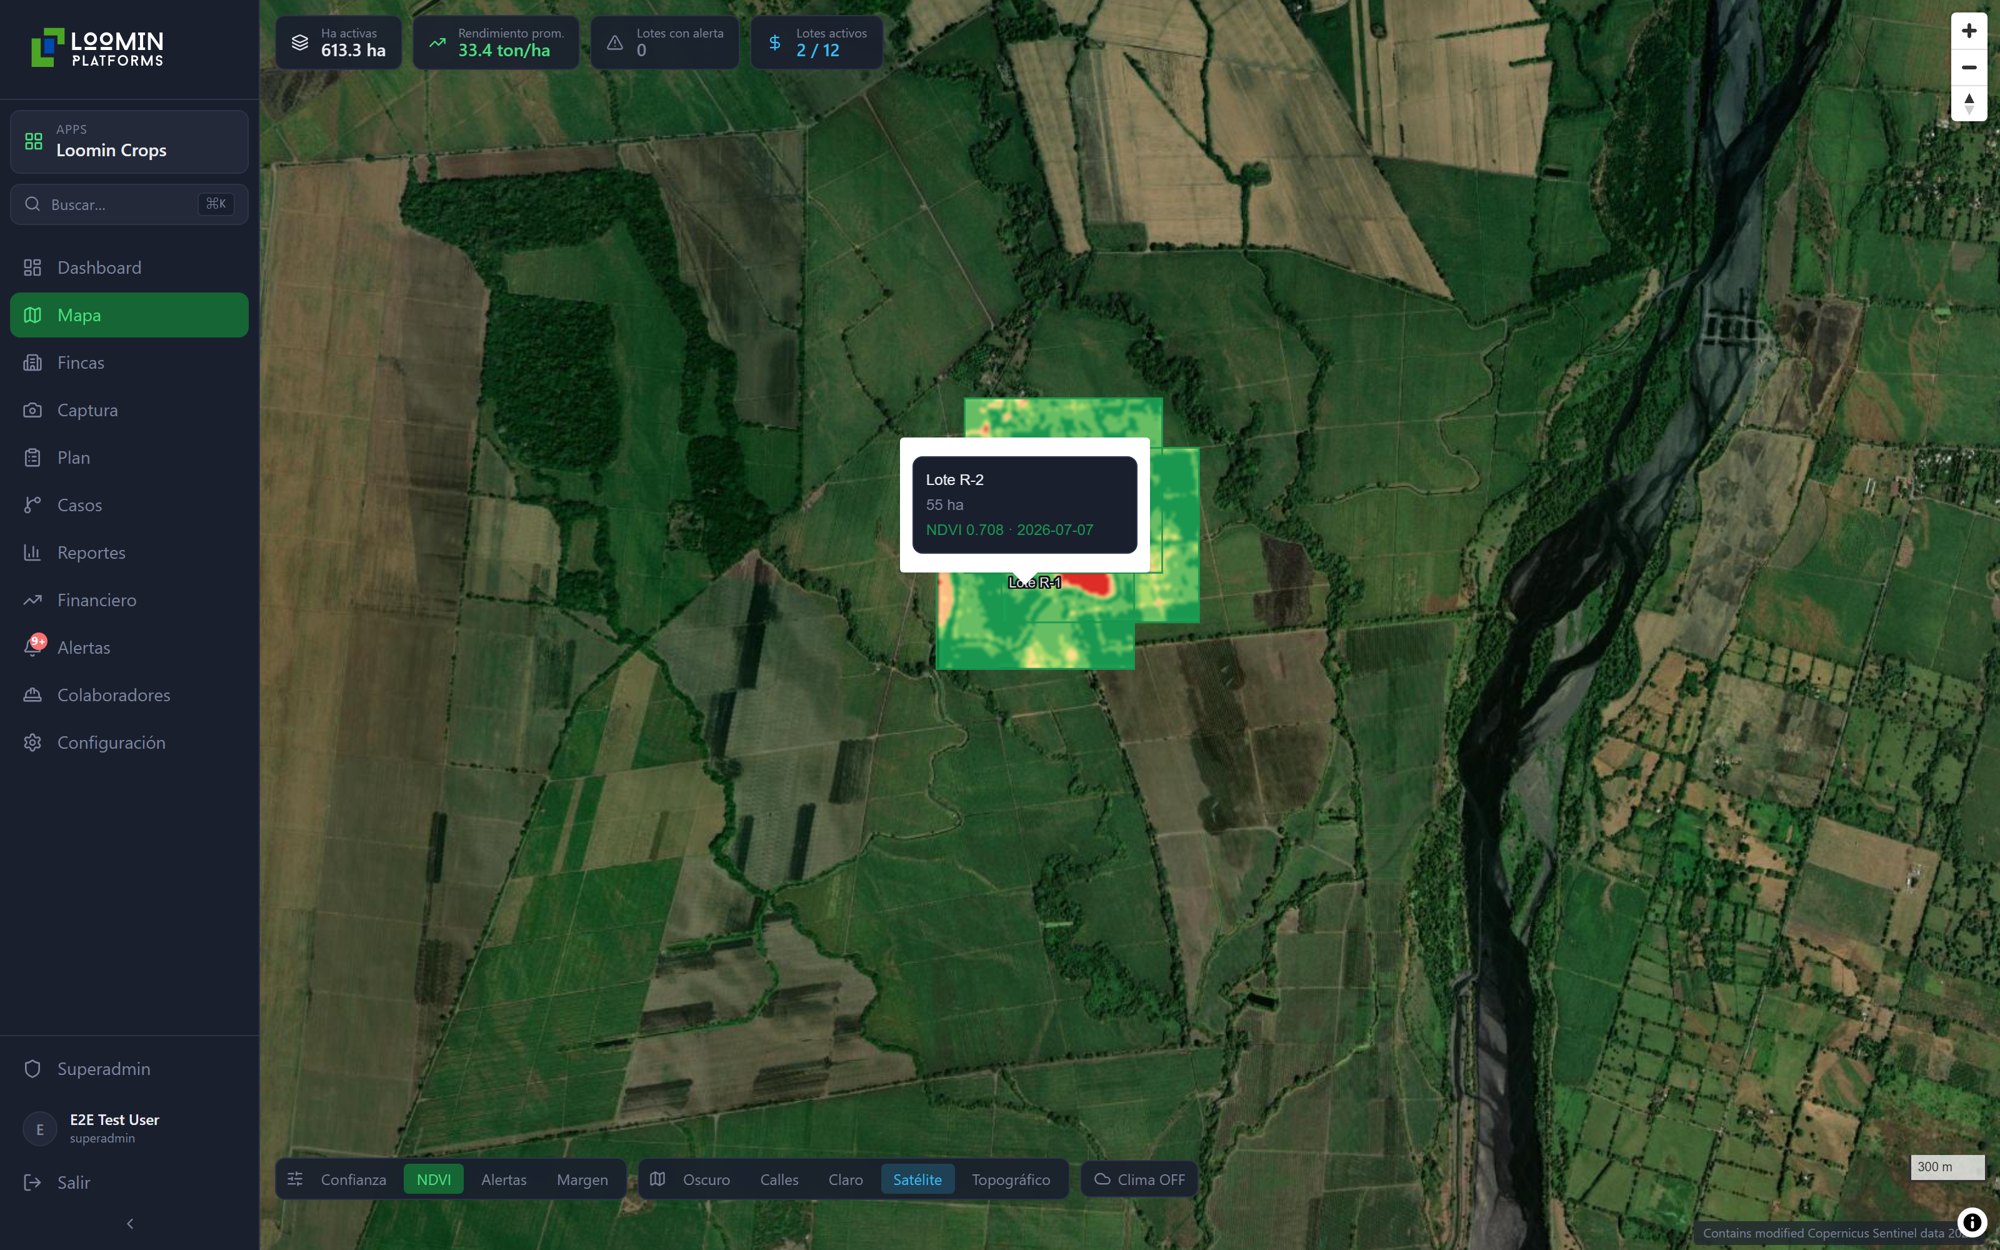
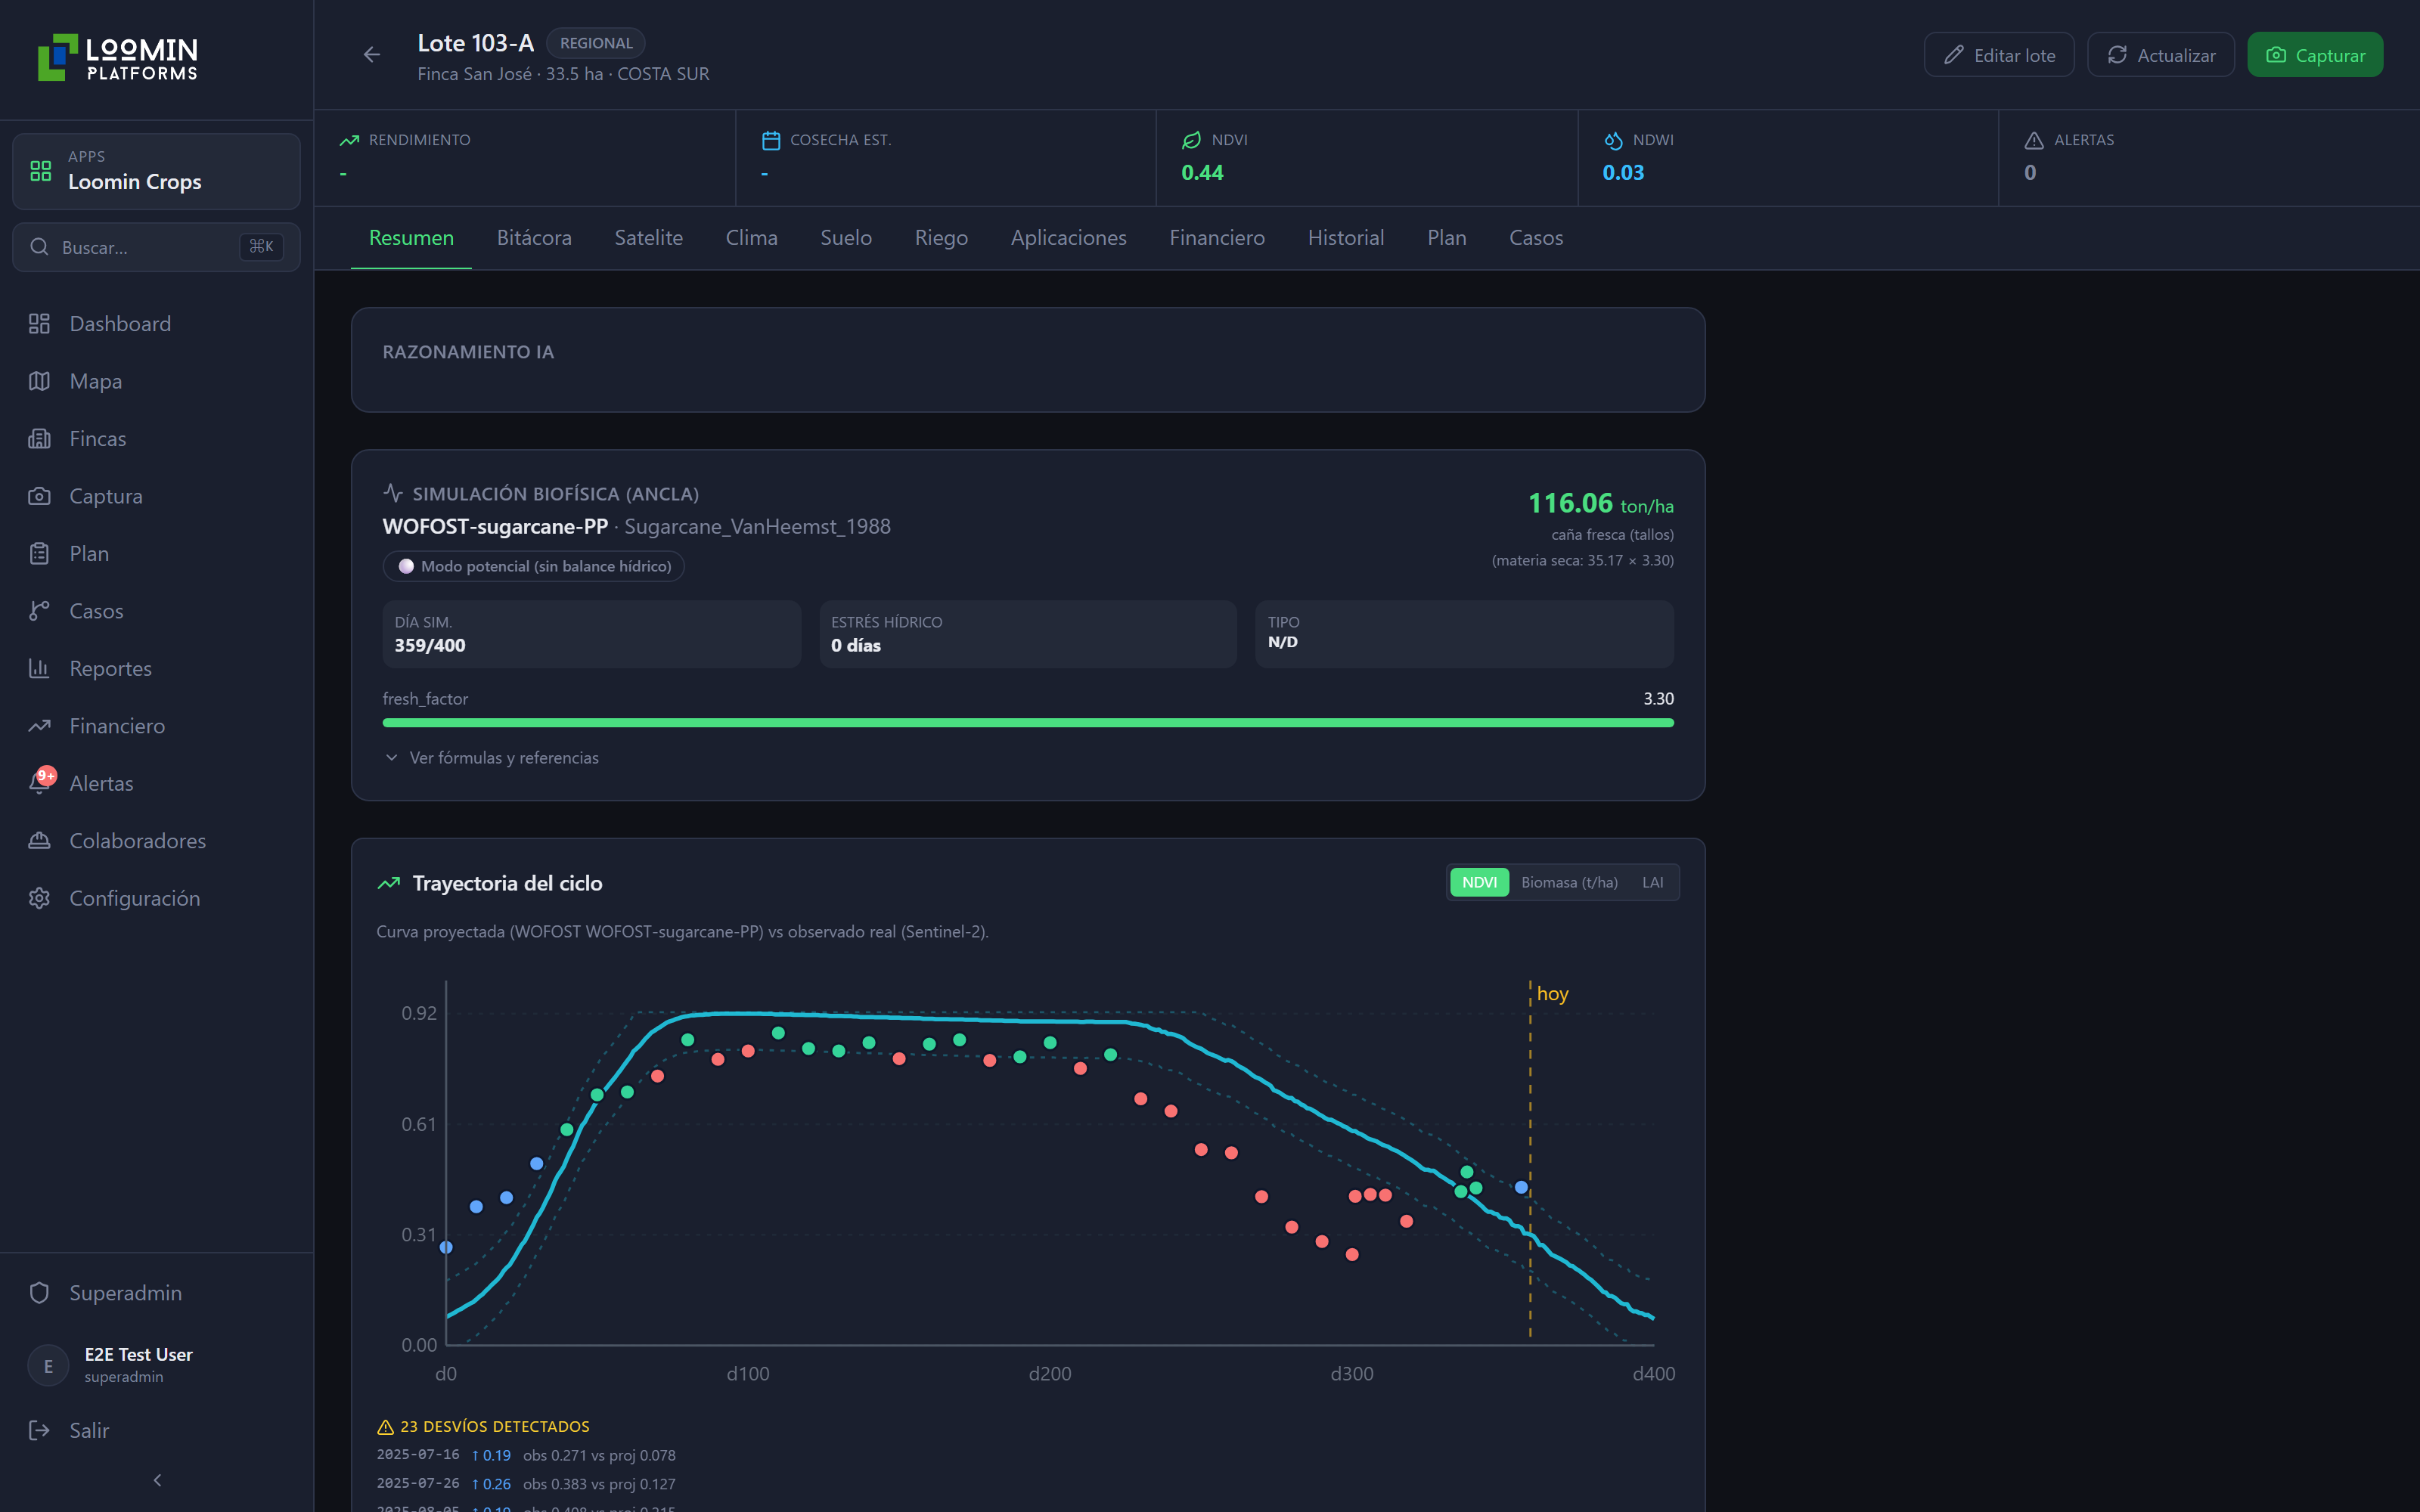
This isn’t a metrics dashboard to stare at. Every feature exists to answer a specific management question —and hand you the action, not the data.
Yield and season trajectory per plot, with a confidence range that tightens every week.
Vigor drops, water stress and pest hotspots detected from space, before they’re visible on the ground.
How much and when to irrigate and fertilize, based on each plot’s actual water balance.
The optimal harvest point and the simulated effect of ripeners on yield.
Revenue, cost and margin per plot and per farm, updated with every logged application.
A per-plot calendar with suggested field work based on growth stage and detected deficits.
Simulate management scenarios and compare yield and margin before you commit.
A photo, a voice note or a text from the field technician becomes structured data and updates the forecast.
Your lab results refine the forecast; without them, we use a baseline and tell you so.
Not a generic average: each crop has its own growth science behind it.
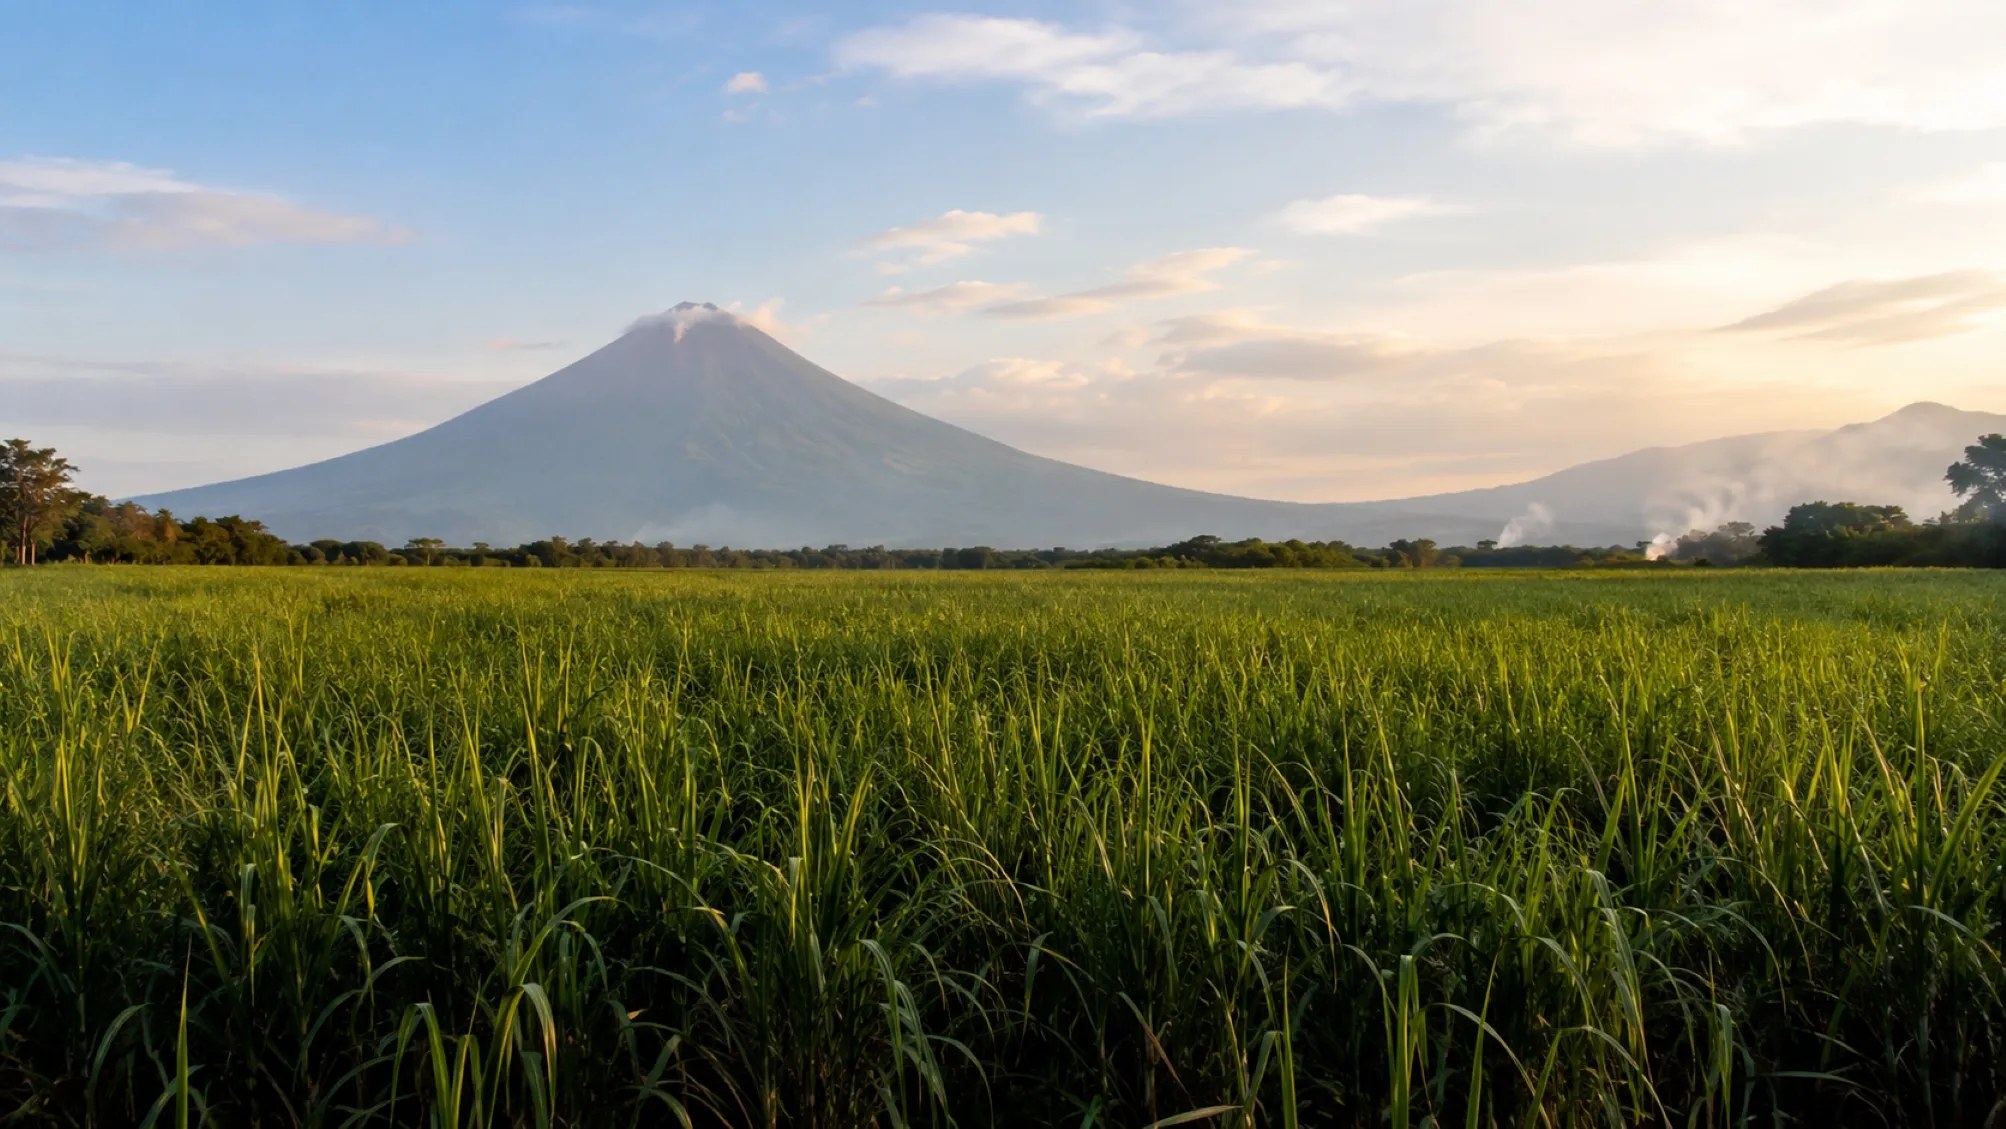
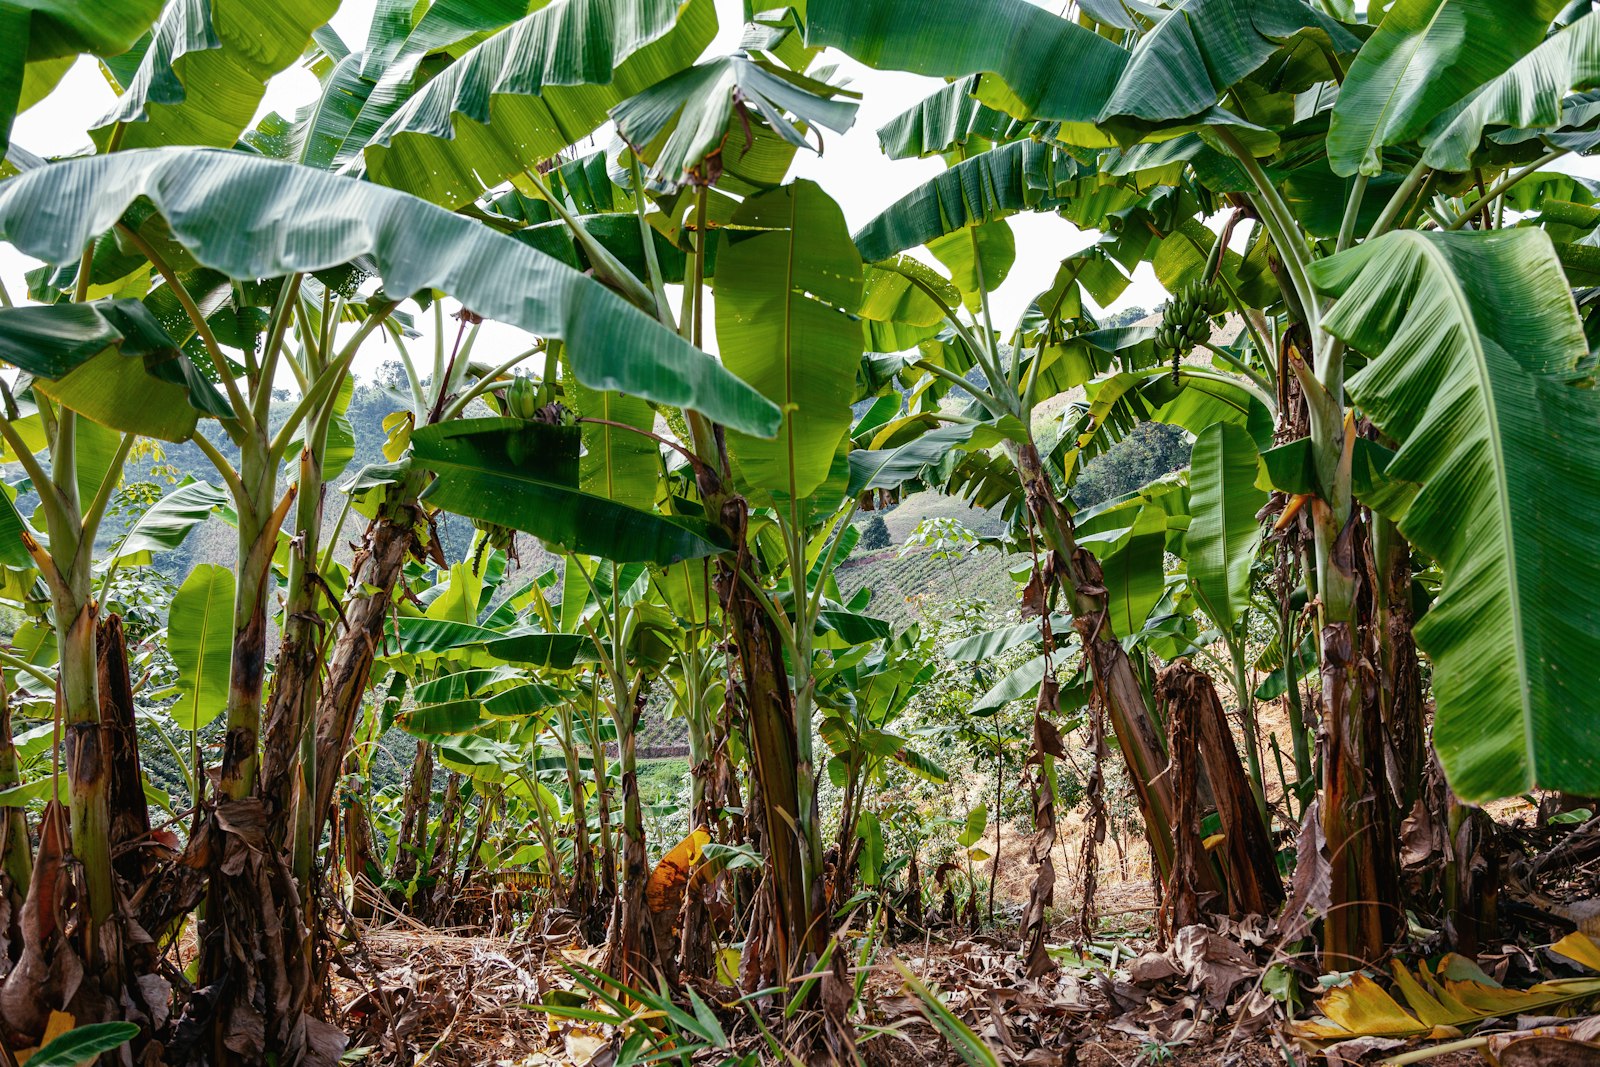
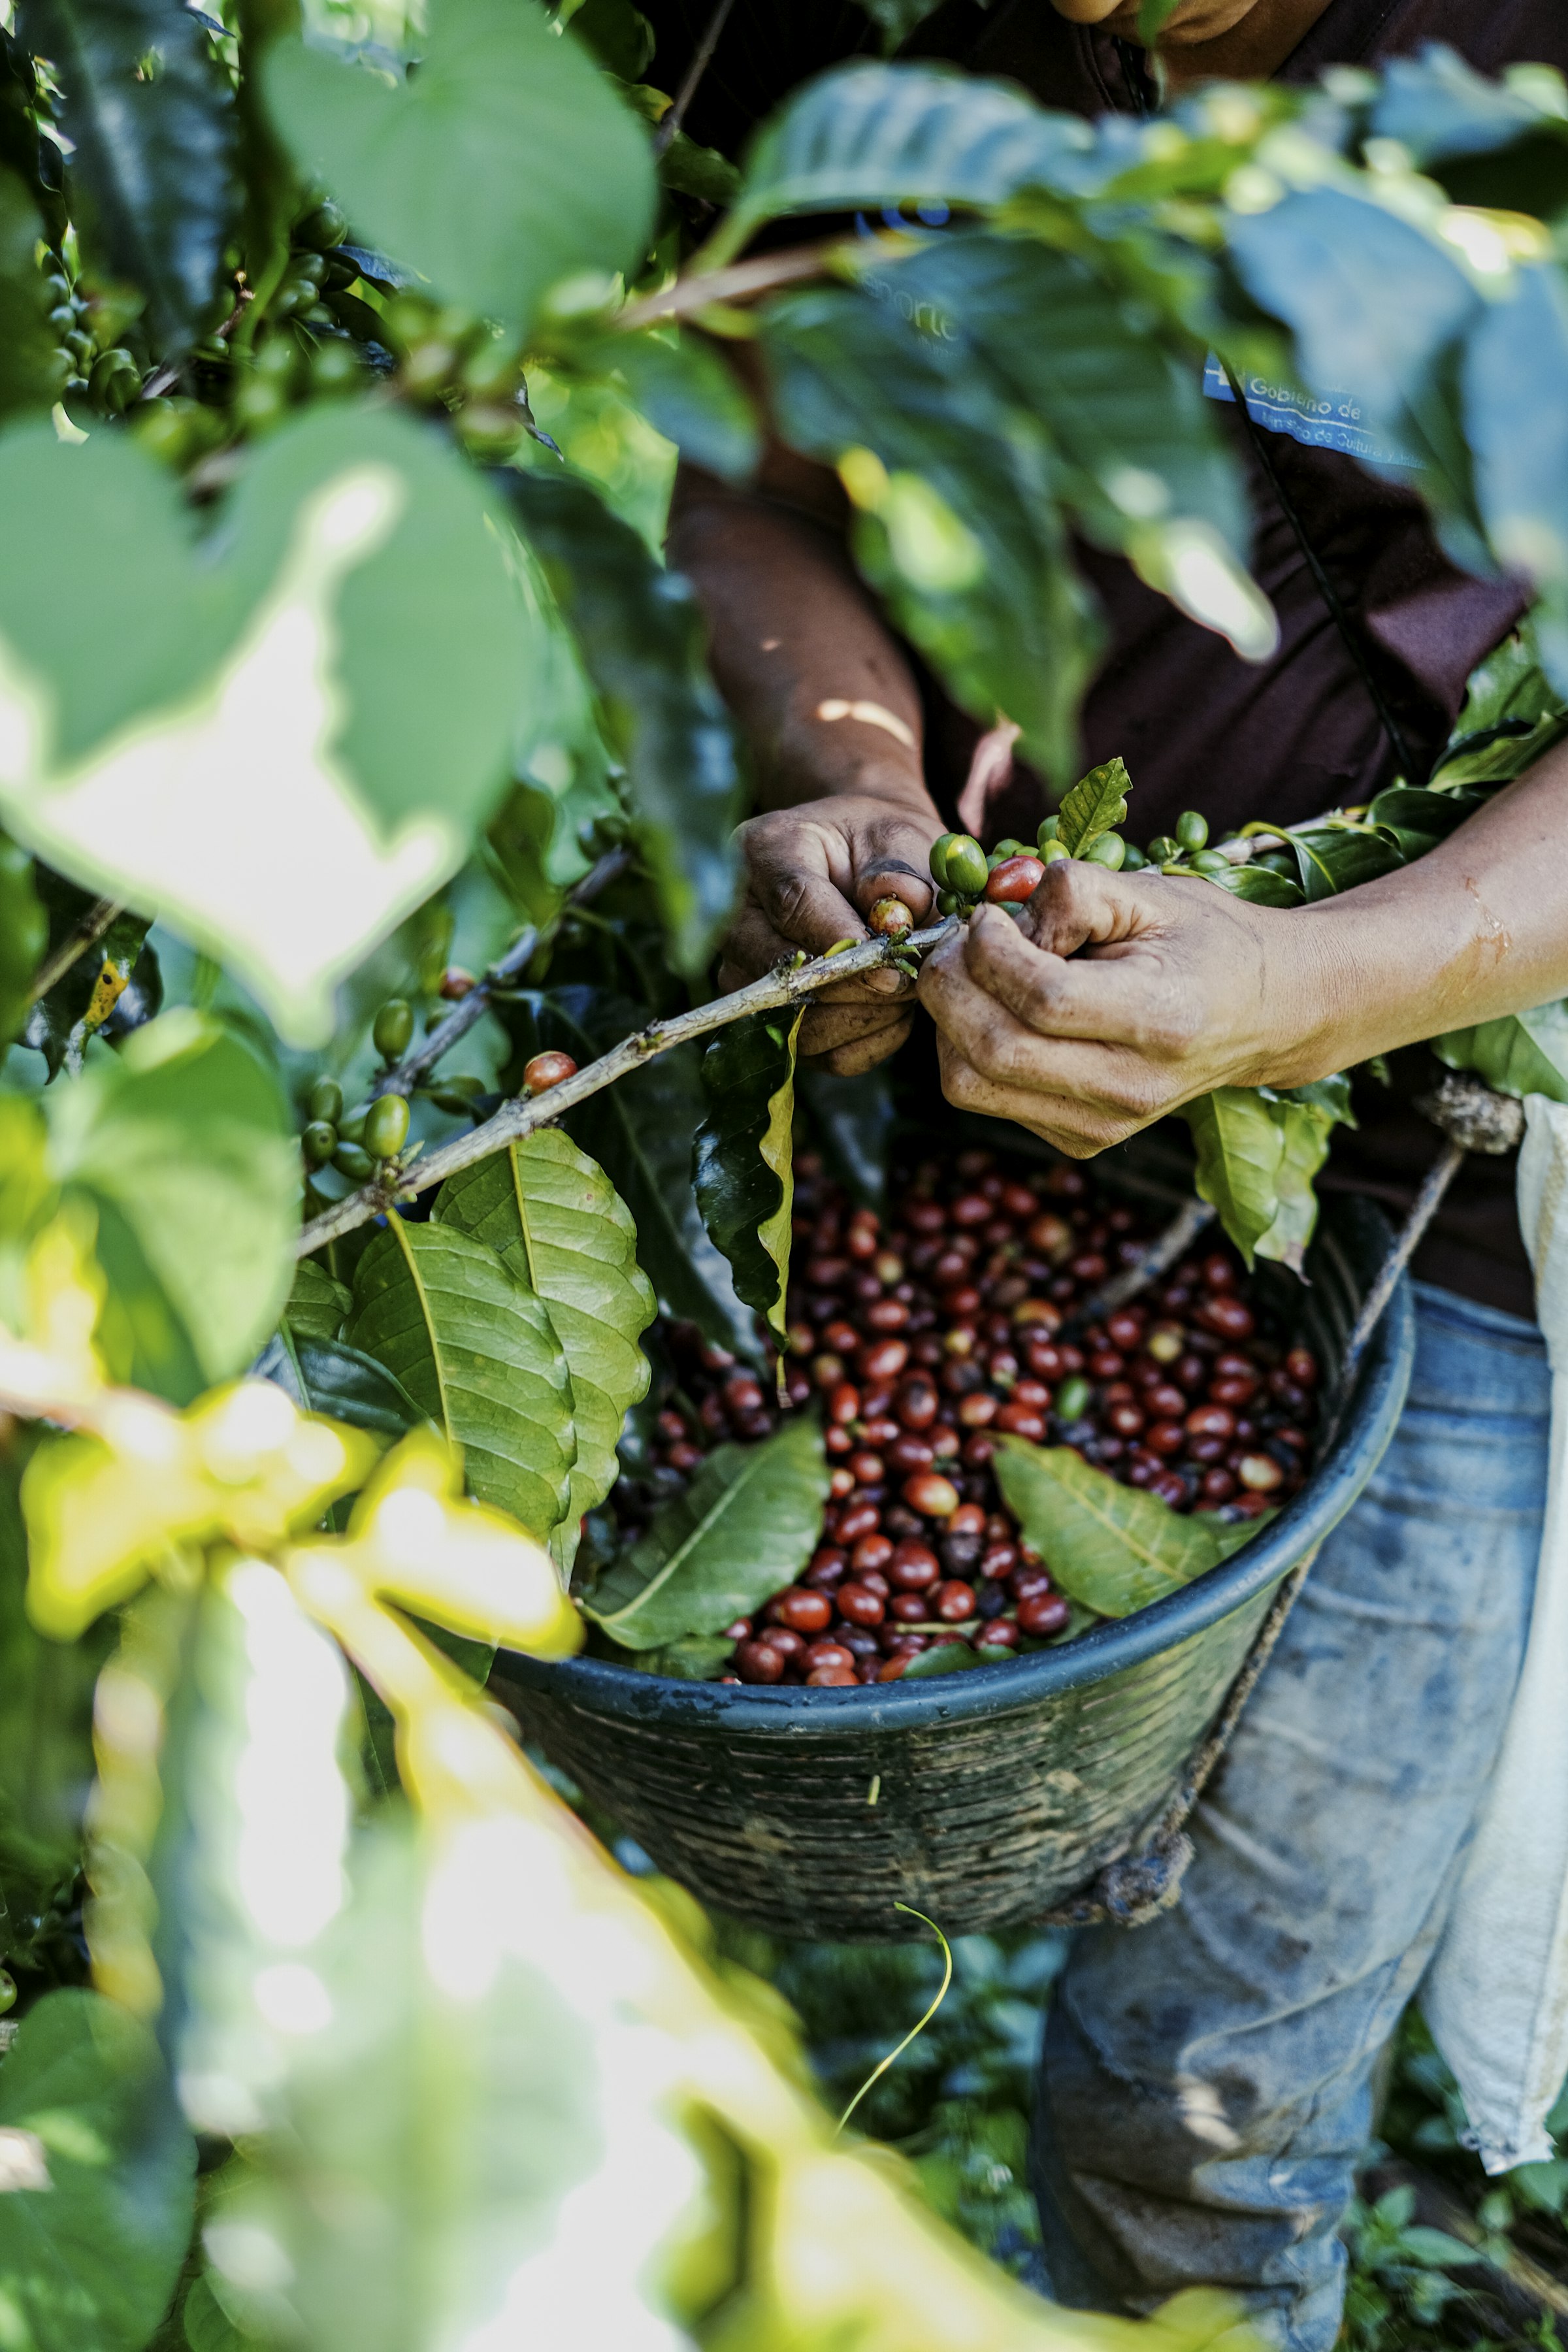
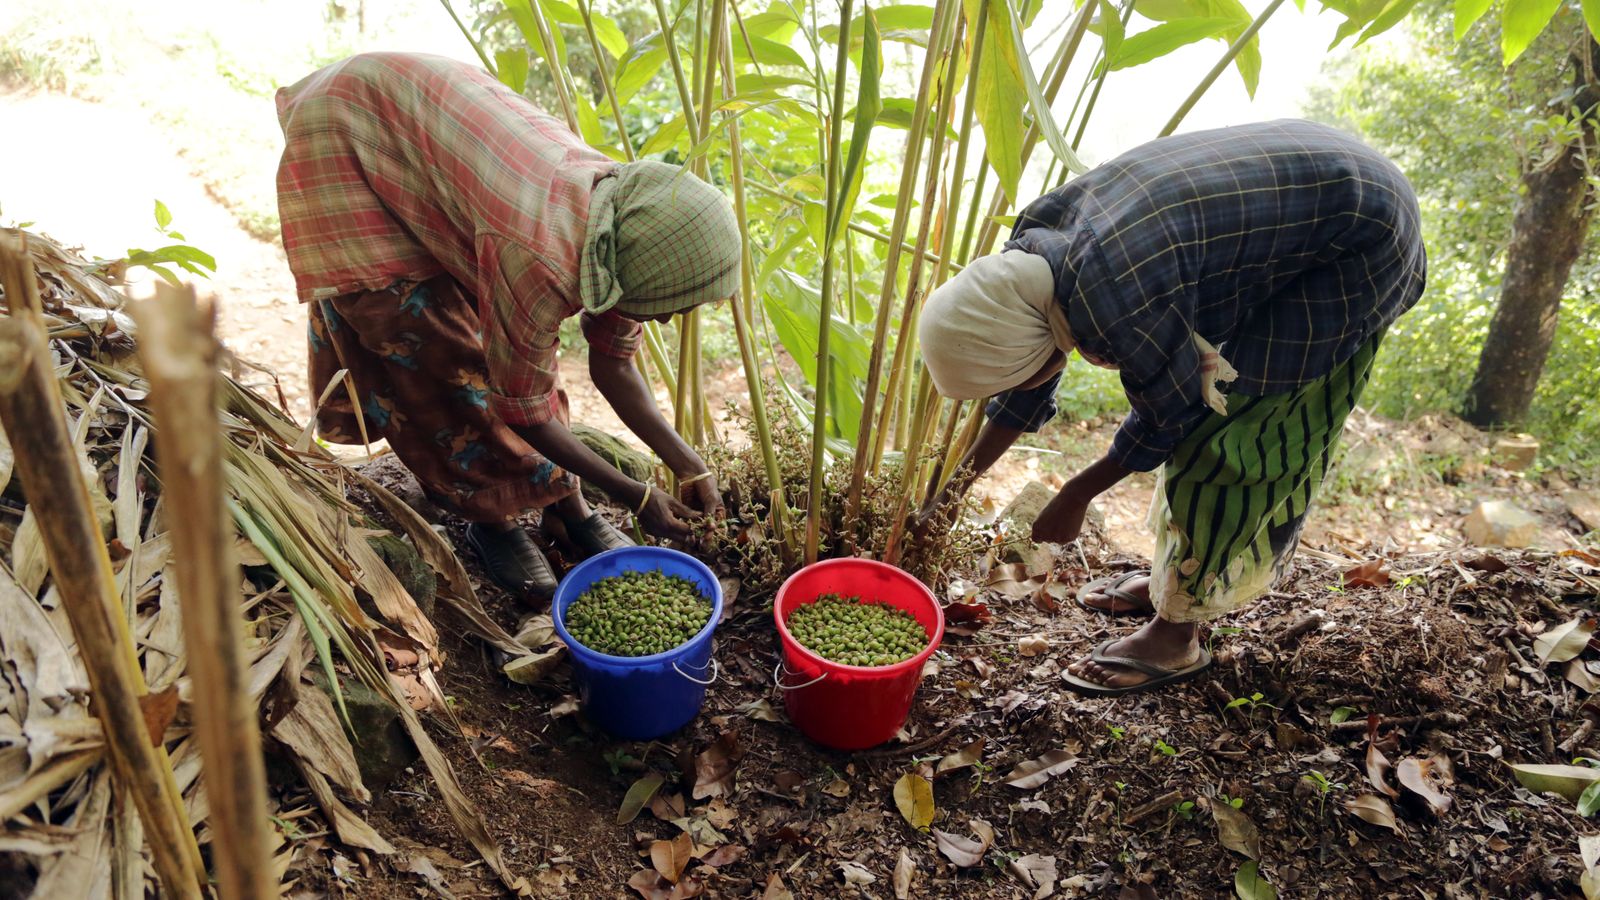
Not a black box. Every forecast rests on sources and models you can review —and we tell you how confident we are in every number.
Multispectral images of your fields every 5 days at 10 m resolution, from the European Space Agency’s Sentinel-2 program. Open, permanent access —the same source governments use.
The same crop-simulation standard used by universities and agronomic research institutes worldwide, calibrated for the region’s conditions.
Every recorded harvest sharpens the model for the next season. Accuracy grows with you —and your data stays yours.
Data honesty isn’t a feature: it’s how we work. No recommendation is presented with more certainty than the evidence supports.
The same system across the region’s crops. Ten hectares or ten thousand: the decision is just as clear.
All your agronomic information in one place, returned as decisions you can make today —starting with a single plot.
Book a demo